Top
This Help File contains instructions for the topics below.
Using ThermoWorks Cloud
- Accessing ThermoWorks Cloud
- Through the ThermoWorks App (BBQ Devices)
- In a Desktop Browser
- ThermoWorks Cloud Dashboard
- Top Messages
- Devices Added to Your ThermoWorks Account
- Recent Events
- Checklist Quickstart Guide
- How to create checklists to use with compatible devices
- How to navigate checklists on mobile devices
- How to select devices to use with your checklist(s)
- Locations
- List of Locations and Devices Connected to Each Location
- Add a Device to a Location
- Device Dashboard
- How to Access
- Dashboard
- About Device Graphs
- About Device Channels
- Dashboard Menu Options
- Events
- Sessions
- BlueDOT Settings
- Signals Settings
- Smoke Gateway Settings
ThermoWorks Cloud Settings
- User Settings
- User Profile
- User Notifications
- Account Settings
- Edit Account Name
- Add or Edit Users
- Locations
- Devices
- Billing
- Advanced (Delete account)
Notifications
Data Logger Specific Information
- Managing Data Loggers in ThermoWorks Cloud
- Connecting your ThermaData WiFi logger to your Wi-Fi network
- Adding a Device to Your Account
- Device Dashboard
- Top Messages
- About Graphs
- About Sessions
- Sensor Settings
- Dashboard Menu Options
- Events
- Archives
- Settings
- Info
- Monitors
A
ThermoWorks Cloud
Accessing ThermoWorks Cloud
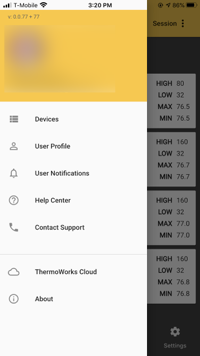
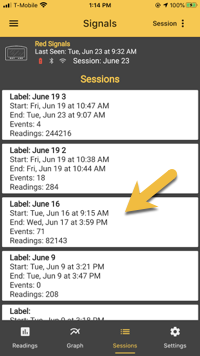
To access ThermoWorks Cloud through the ThermoWorks app, either choose ThermoWorks Cloud from the left-hand menu in the app or click on a saved session from the Sessions menu. You will be asked to login to ThermoWorks Cloud the first time you access it.
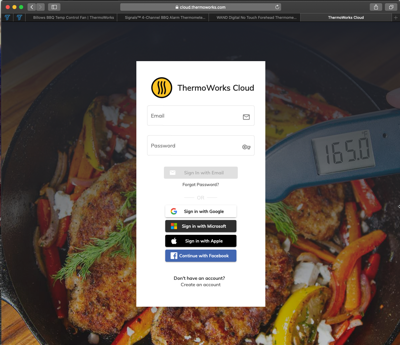
To access ThermoWorks Cloud in a browser window, navigate to https://cloud.thermoworks.com. You may log in using your Google, Microsoft, Apple, or Facebook accounts.
Important: You will use the same login credentials for both the ThermoWorks app and ThermoWorks Cloud.
Back to Top
B
ThermoWorks Cloud Dashboard
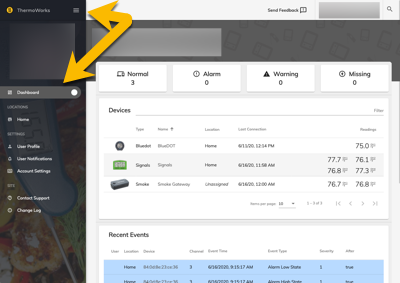
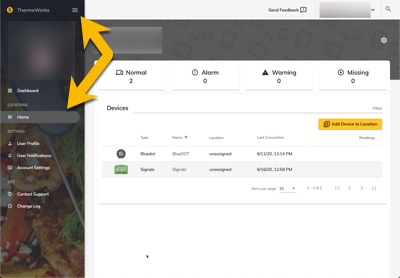
To view a list of all of the devices you have attached to your account, navigate to your Dashboard via the menu, found at the top-right corner of the window.
Top Messages
Normal: This is the total number of devices you currently have attached to your account that are not in another state.
Alarm: The number of data loggers that have exceeded their high or low temperature limits.
Warning: The number of data loggers that are close to exceeding their high or low temperature limits.
Missing: The number of data loggers that have missed a set number of transmissions (if Monitor is enabled).
Devices
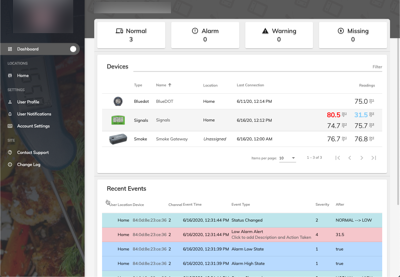
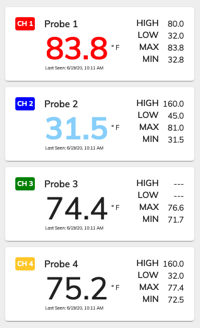
The Devices section includes this information:
- Type of device
- Device name
- Device location
- The device’s last connection date and time
- Current channel temperature readings. If the numbers are black, the current temperature reading is within the set limits. When the temperature is blue, the low temperature limit has been exceeded. When the temperature is red, the high temperature limit has been exceeded.
You may access a device’s dashboard (containing its current graph, channel readings, notes, events, sessions and settings) by clicking on its name.
Recent Events
You will see the following information about your attached devices in the Recent Events section.
- Where the device is located
- The date and time the event occurred
- The event type
- The severity of the event
- Event details and who made the change, if possible
- User associated with the event
Event Details
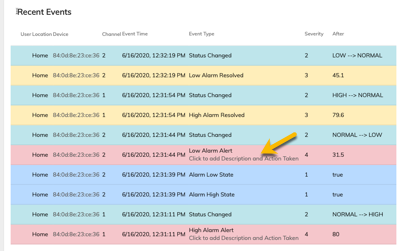
You can add more details to Severity 4 events with the Click to add Description and Action Taken link.
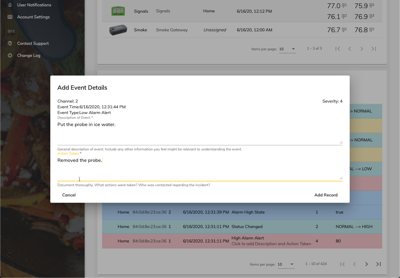
Add the details in the pop-up dialogue. Choose Add Record to continue.
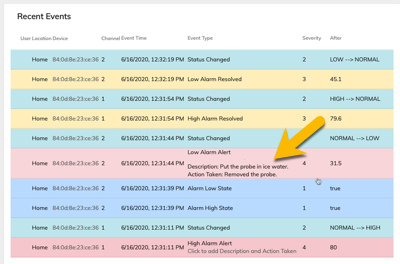
You will then see the details you added about the event.
Note: Once details have been added to an event, they cannot edited as they become part of the permanent record. You may add additional details to the event, if needed.
C
Locations
To view a list of all of the devices you have assigned to a location, click on the location’s name under the Locations tab. (In this example, the location is named Home.)
There are two ways to add a device to a Location:
- Location>Location Name>+ Add Device to Location button.
- Device Dashboard>Settings>Top-right Menu>Assign to Location.
Note: If you have not previously set up a location, you can add one here: Account Settings>Locations>Add Location.
Back to Top
D
Device Dashboard
How to Access
There are three ways to access a device’s dashboard:
- ThermoWorks Cloud Dashboard > Select device
- Locations > Location Name > Select device
- If a device has been previously set up in your account, you may search for the device’s name, serial number, account name, or location (top-right corner of window) > Select device
About Graphs
Important to Know About Graphs
- A BBQ device’s (BlueDOT, Signals, Smoke Gateway) session’s graph begins at the point in which you started the session and stops when either 24 hours have passed, you manually end the session or start a new session.
- In order to archive a session graph that starts when you want it to, you must start a new session at the time in which you wish the graph to begin.
- You may save an unlimited number of graphs.
- All archived graphs are located in ThermoWorks Cloud; they are not saved to your smart device.
Current Graph Display
A device’s dashboard displays up to the last 24 hours of the current graph.
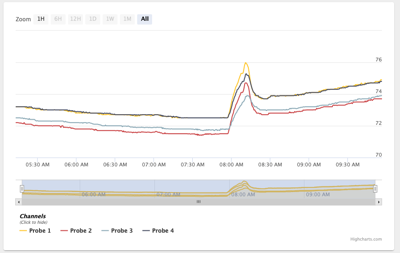
Working with Graphs
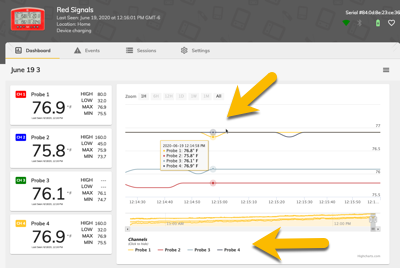
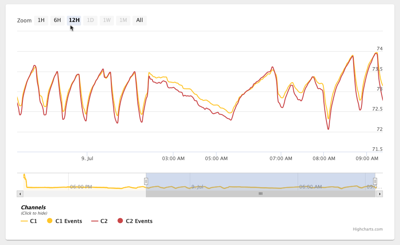
Hover over the graph with your mouse to see the exact date, time and temperature. Click on a channel’s name in the bottom list to hide its channel on the graph. Click again to show it.
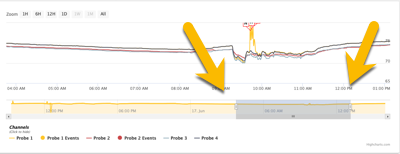
Use the sliders at the bottom to zoom in on a portion of the graph.
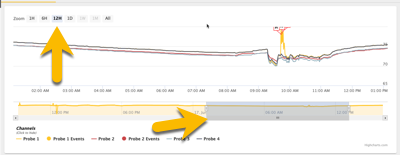
Select a period of time you wish to view at the top-left of the graph. Use the bottom slider to move the time selection along the graph. Any time period that is not available to select is greyed out.
Note for BBQ device users: Because the graph on the device dashboard contains up to the last 24 hours of data, you can only select the time periods available in relation to the length of the graph. The example above demonstrates the available time selections for an 24-hour session graph.
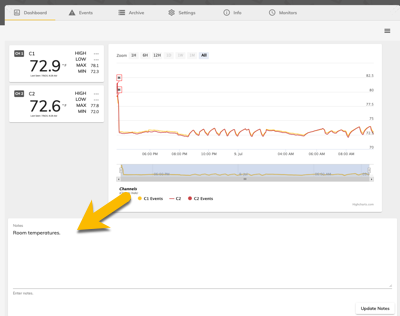
Notes

You may add notes to the graph in the Notes field.
To include the notes you have added to the archive, choose End Session or Archive Current Graph. The graph will reset and any notes entered will be saved.
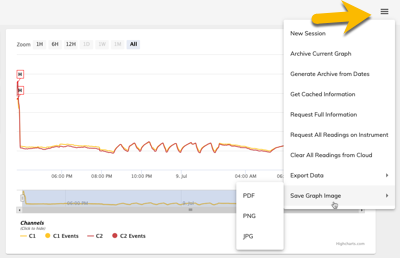
Save Current Dashboard Graph as Image
Use the top right-hand menu on the dashboard to archive the current graph or save it as .pdf, .png, or .jpg image.
Back to Top
About Channels
Accessing and Modifying Channel Settings
Note: While you may set up and manipulate Smoke Gateway alerts, alarms, graphs, and sessions in ThermoWorks Cloud, you may not change Smoke’s hardware settings from ThermoWorks Cloud as Smoke + Smoke Gateway includes one-way communication. Two-way communication is required to change hardware settings from ThermoWorks Cloud.
BlueDOT and Signals users may edit hardware settings in ThermoWorks Cloud as they include two-way communication.
From the channel list, choose the channel you wish to edit by clicking on it.
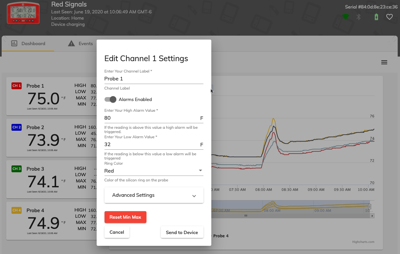
Use the Channel Settings dialogue to edit the following:
- Name the channel (Note: If using Signals, the first 4 digits of the name will appear on the hardware’s display.)
- Enable or disable alarms
- Set high and low alarms
- Set the probe ring color
- Reset Min Max history
- Advanced: Change the calibration trim adjustment (BlueDOT and Signals only)
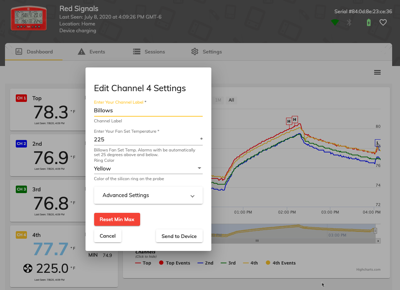
If you are using Billows with Signals, use the Channel Settings dialogue to edit the following:
- Name the channel
- Enter the fan set temperature (Note: Alarms will automatically be set 25° above and 25° below the set temperature.)
- Set the probe ring color
- Advanced: Change the calibration trim adjustment
- Reset Min Max
Once you have edited the channel settings, choose Send to Device to continue.
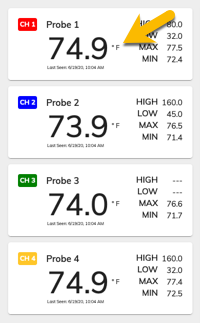
Channel Alarm Colors
When the current temperature numbers are blue, the low temperature limit has been exceeded. When the temperature is red, the high temperature limit has been exceeded.
Back to Top
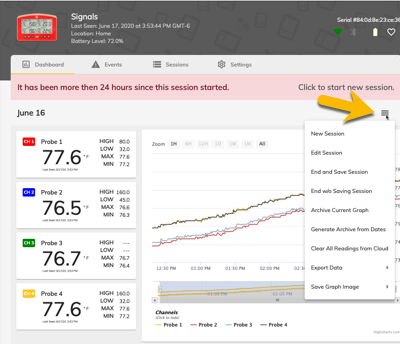
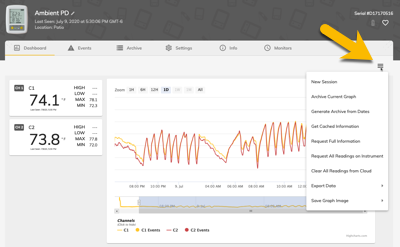
Device Dashboard Menu Options
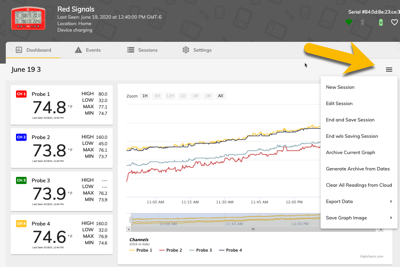
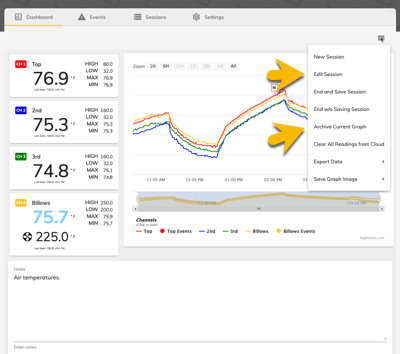
Use top right-hand menu, available on the device’s dashboard to…
- Start a new session
- Edit the session’s name
- End and save the current session
- End without saving
- Archive the current graph
- Clear all of the device’s readings from ThermoWorks Cloud Important: This command will clear any readings stored in ThermoWorks Cloud from the device you are working with; it cannot be undone.
- Export data to an Excel 2007+ or .csv file
- Save graph as .pdf, .png, or .jpg file
Back to Top
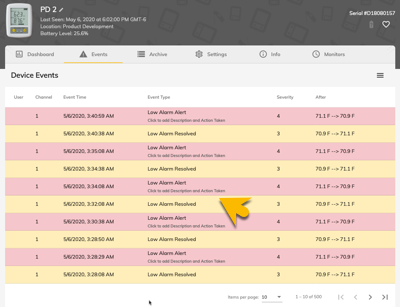
Events
The Events tab contains all of the events that have occurred while using your device. The information includes:
- Which probe or sensor was affected
- The date and time of the event
- The severity of the event
- Event details and who made the change, if possible
- User associated with the event
You can add more details to Severity level 4 events with the Click to add Description and Action Taken link.
Add the details in the pop-up dialogue. Choose Add Record to continue.
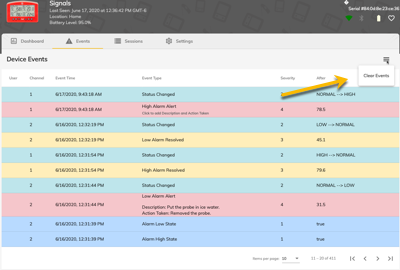
You can clear the events history via the Clear Events command (available in the top left-hand menu).
Note: This request clears the device’s current sessions’ events list. It does not remove events associated with archived sessions.
Back to Top
Sessions
Important to Know about Sessions
- Sessions allow you to archive graphs along with any notes you make about the process.
- All session archives are located in ThermoWorks Cloud; they are not saved on your smart device.
- Saves information about all of the probes or sensors attached to the device (channel names, Min Max)
- You may save an unlimited number of sessions.
- Starting a new session resets the graph and the Min Max history.
- We recommend that you start a new session each time you begin a new cook.
Device Sessions Tab
The Sessions tab contains a list of all of your archived sessions. The Saved Sessions tab contains all of your saved sessions. The Manual Archived contains all of your manually archived graphs.
Click View to see a sessions’ archive.
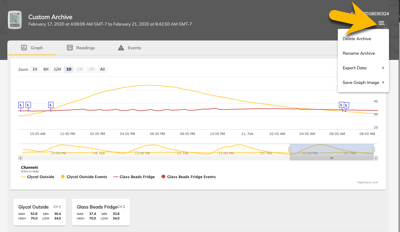
A Session Archive contains:
- The session’s graph
- Archive notes (You may edit the notes.)
- The readings taken during the session
- Events list
You can delete the archive, rename the archive, export the data to an Excel 2007+ or .csv file, or save the graph as a .png, .jpg, or .pdf image file via the top right-hand menu, found in the upper right-hand corner of the window.
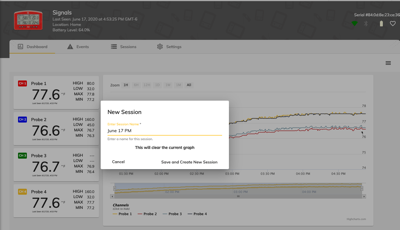
To start a new session, go to the device’s dashboard and select New Session from the top right-hand menu. You can also edit the current session, end and save it, end without saving it, archive its graph, clear all readings, export data, and save the graph image here.
If you are using a BBQ device (BlueDOT, Signals, or Smoke Gateway) and it has been more than 24 hours since the session started, you will be notified that you need to start a new session.
Important: A session’s graph begins when you start a new session and stops when either 24 hours have passed or you manually end the session.
Adding Session Notes
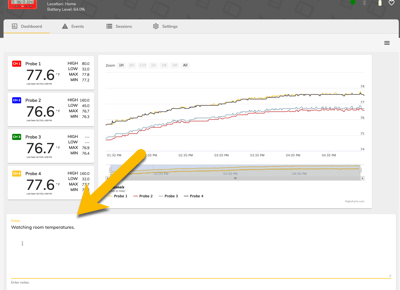
To add or edit notes about the session, navigate to the device’s dashboard and scroll down to see the Notes section. Any notes you have saved will be found here.
Back to Top
BlueDOT Settings
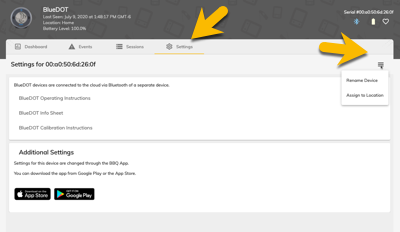
Renaming the Device
Use the top right-hand menu to change the name you see on the device’s dashboard
Assign to a Location
Use the top right-hand menu to rename your device or to assign it to a location.
Signals Settings
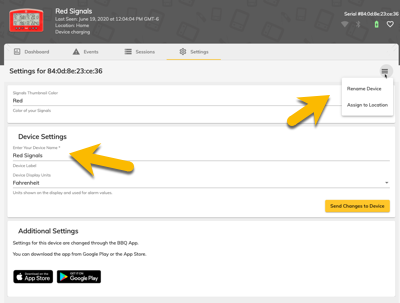
Renaming the Device
- Edit the name in the Enter Your Device Name* field to rename your device.
- Use the top right-hand menu to change the name you see on the device’s dashboard
Assign to a Location
Use the top right-hand menu to rename your device or to assign it to a location.
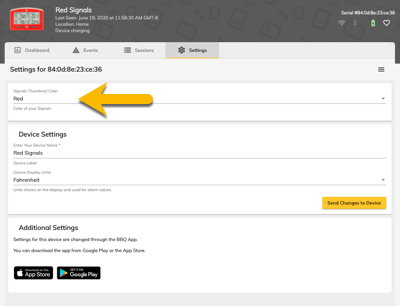
Change Thumbnail Color
Change the color of the Signals thumbnail displayed in ThermoWorks by selecting the color from the drop-down option list.
Smoke Gateway Settings
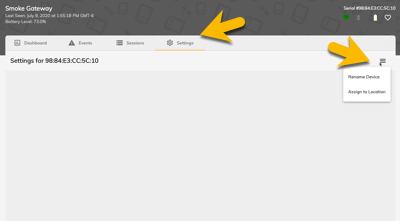
Renaming the Device
Use the top right-hand menu to change the name you see on the device’s dashboard
Assign to a Location
Use the top right-hand menu to rename your device or to assign it to a location.
Back to Top
E
ThermoWorks Cloud Settings
User Profile
User Detail
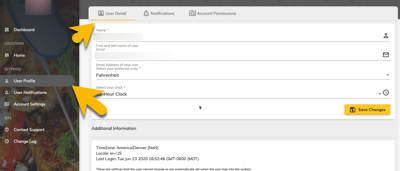
Use the User Detail tab to…
- Edit the user’s name
- Set the preferred units (F° or C°)
- Set the clock for 12 or 24 hours
User Account Permissions
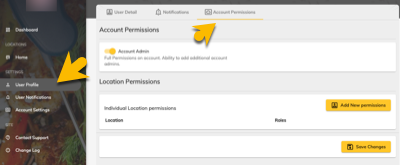
If you are an account Admin, you can assign Admin rights to another data logger user on the Account Permissions tab.

An account Admin can also give the user Read Only (the ability to receive notifications and see data) or Full Access (the ability to receive notifications, see data, and change settings) to a location’s data logger devices.
Back to Top
F
Account Settings
Edit Account Name
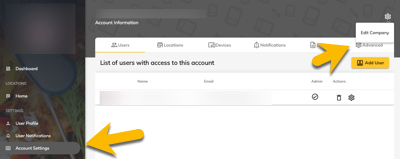
To edit the account name, navigate to Account Settings and click on the gear icon, located at the far-right edge of the tabs. Click Edit Company to continue.
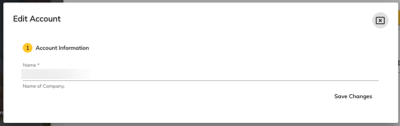
Edit the Account Information (name) and click on Save Changes.
Back to Top
Account Users
Add a New User
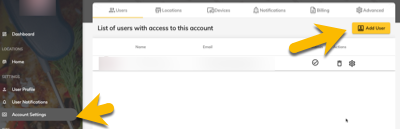
To begin, click on the Add User button, found on the Users tab.
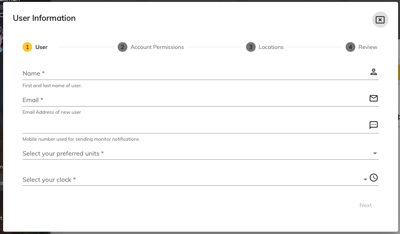
A dialogue box will open to add the user’s name, email address, mobile phone, and the preferred units and clock settings. Click Next to continue.
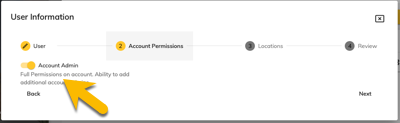
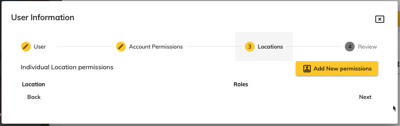
Choose the user’s access level. (Data logger users only.)
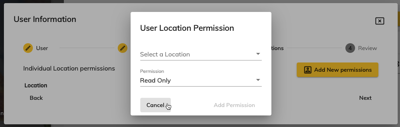
Click on the Add New permissions button to assign the user Read Only or Full Access to a location’s devices. (Data logger users only.)
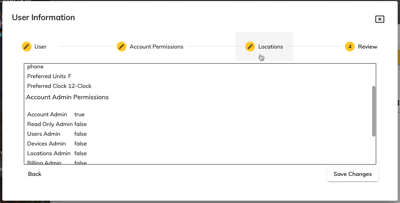
Validate the new user’s settings. Choose to save the changes or go back to edit them, if necessary.
Edit a User
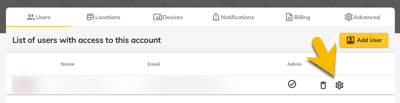
There are two ways to edit a user:
- Click on the gear icon, located at the far-right end of the User listing.
- Click on the user’s name.
Back to Top
Locations
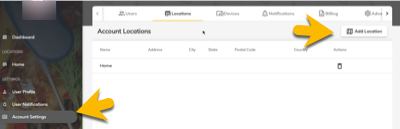
To add a new location, navigate to Account Settings and choose the Locations tab. Click on the Add Locations button.
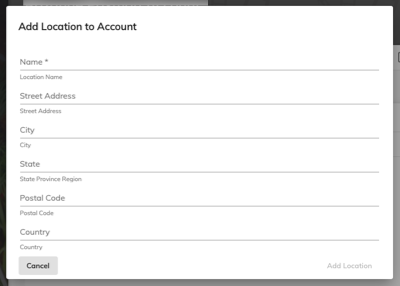
Add the location’s details and choose Add Location to finish.
Back to Top
Devices
To Add a BBQ Device to Your Account
To add BlueDOT, Signals, or Smoke Gateway to your account, add the device via the ThermoWorks app as described in the ThermoWorks App Help File.
Billing
If you have data loggers attached to your account and need additional features or options than are available with a free account, please contact ThermoWorks’ Technical Sales team at [email protected] or 1-800-393-6434.
Note: BBQ device users (BlueDOT, Signals, and Smoke Gateway) do not need a billing plan, as access, notifications, and storage are free for these devices.
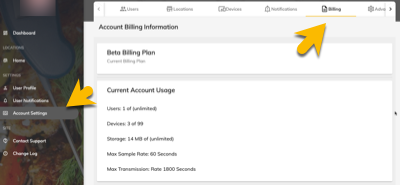
Advanced
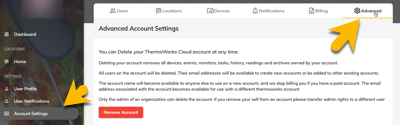
You can delete your ThermoWorks Cloud account at any time. Deleting your account removes all devices, events, monitors, tasks, history, readings, and archives owned by your account.
All users on the account will be deleted. Their email addresses will be available to create new accounts or be added to other existing accounts. The account name will become available for anyone else to use on a new account, and we stop billing you if you have a paid account.
The email address associated with the account becomes available for use with a different ThermoWorks Cloud account. Only the admin user of an organization can delete the account.
If you are an account admin and you remove yourself from an account, please transfer admin rights to a different ThermoWorks Cloud user.
Back to Top
G
Notifications
B
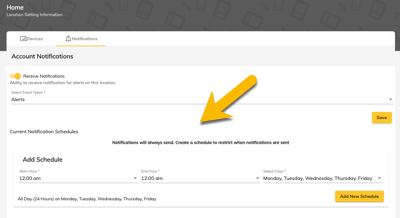
Account Notifications
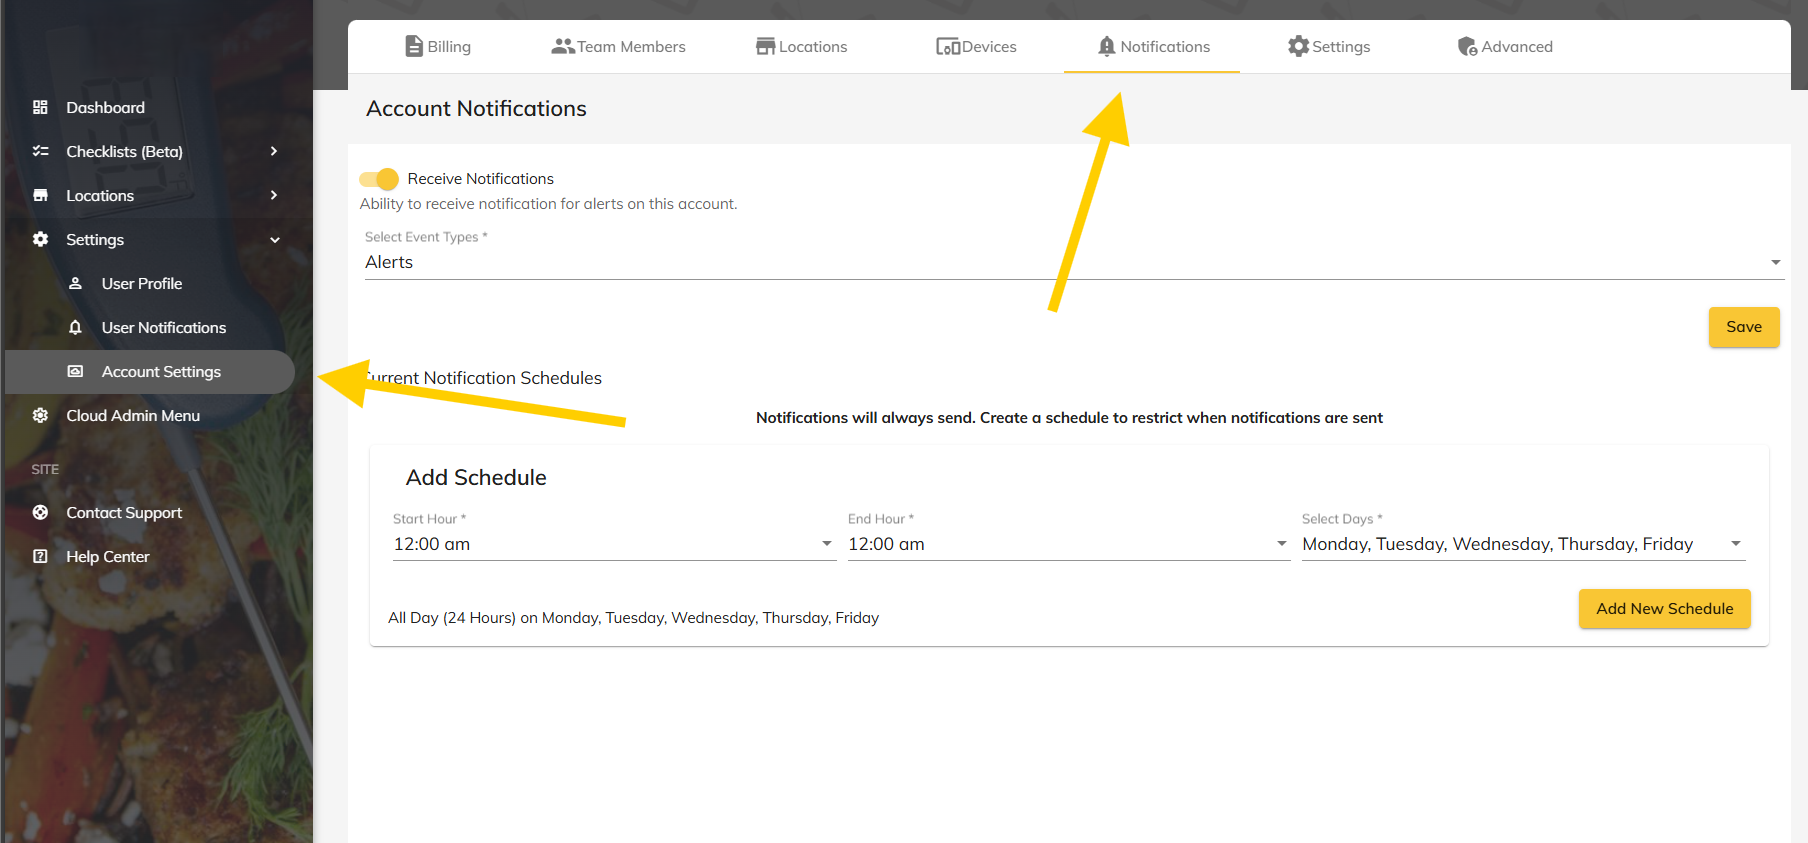
To access the Account Notification settings: Account Settings>Notifications
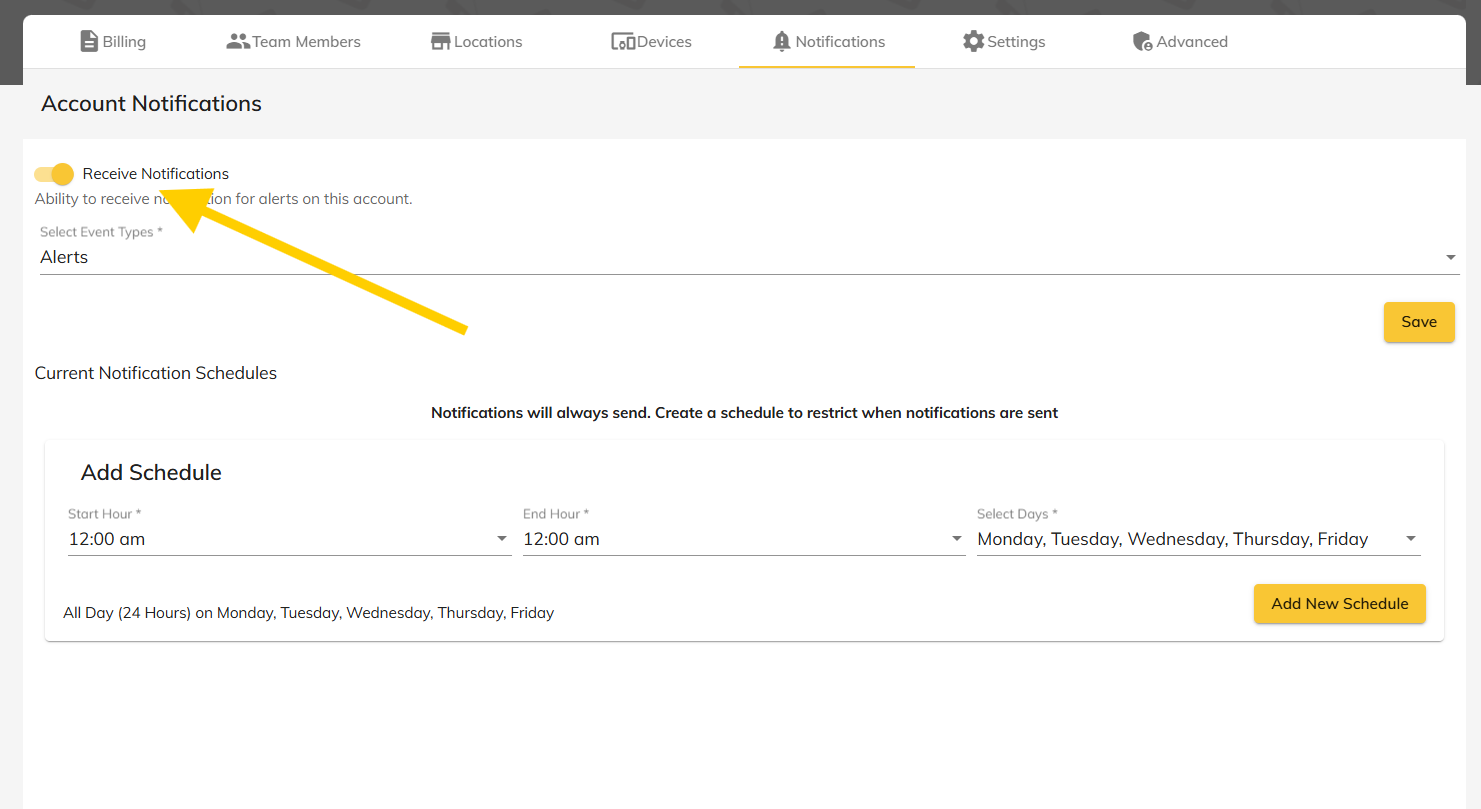
In order to receive notifications, you must enable the account’s notifications. If disabled, notifications cannot be sent, even if notifications are enabled at the location and/or user level.
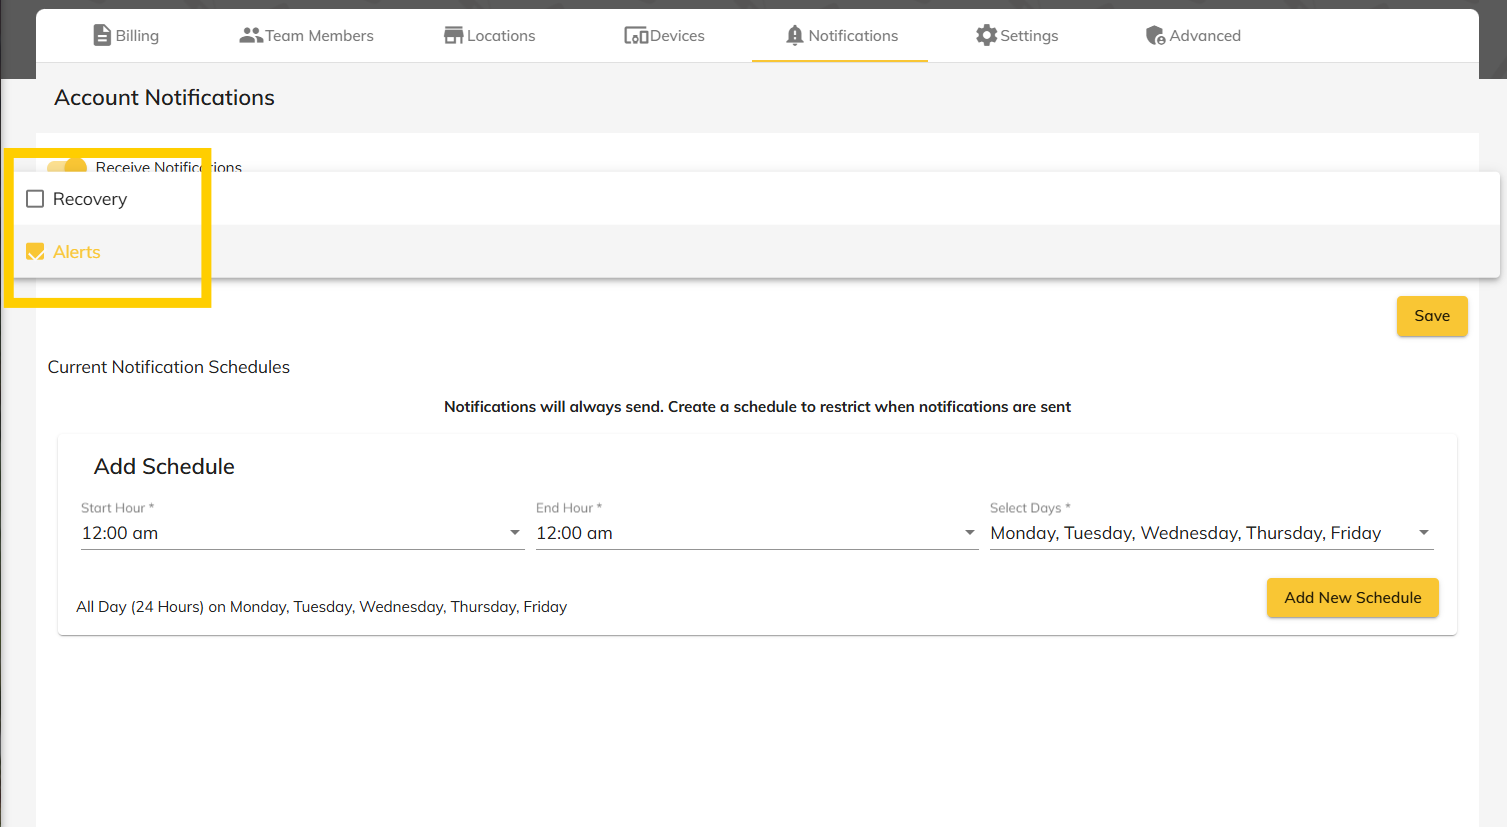
Use the drop-down menu to choose if you’d like to receive Alert notifications (when there are level Severity level 4 events) and/or if you’d like to receive Recovery notifications (when an event returns to a Severity level 3 status).
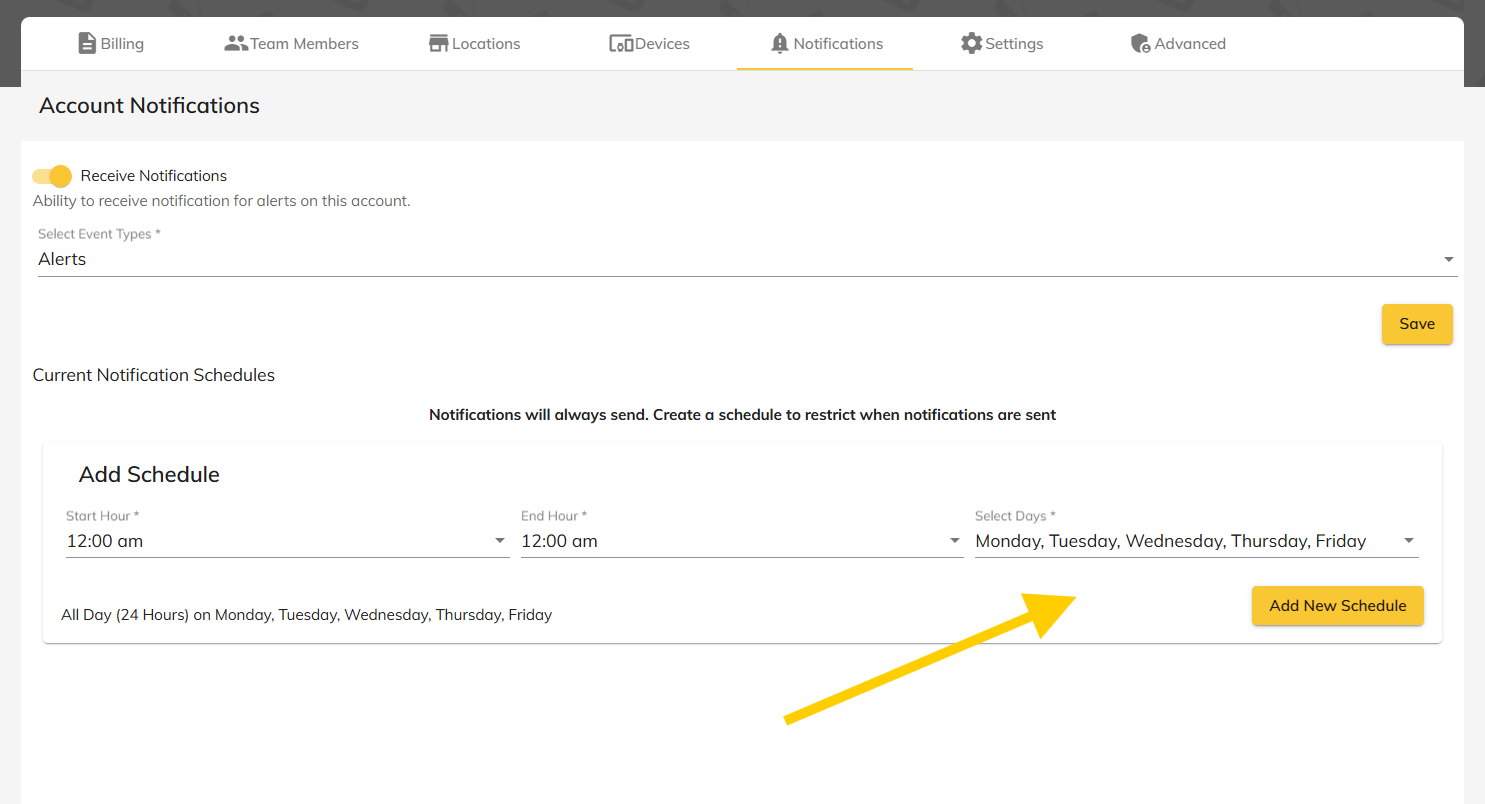
If you’d like to receive alerts according to a certain time schedule, choose the Start Hour, the End Hour, and the days of the week you’d like to receive notifications.
_____
H
Location Notifications
Location notifications are dependent upon account notifications.
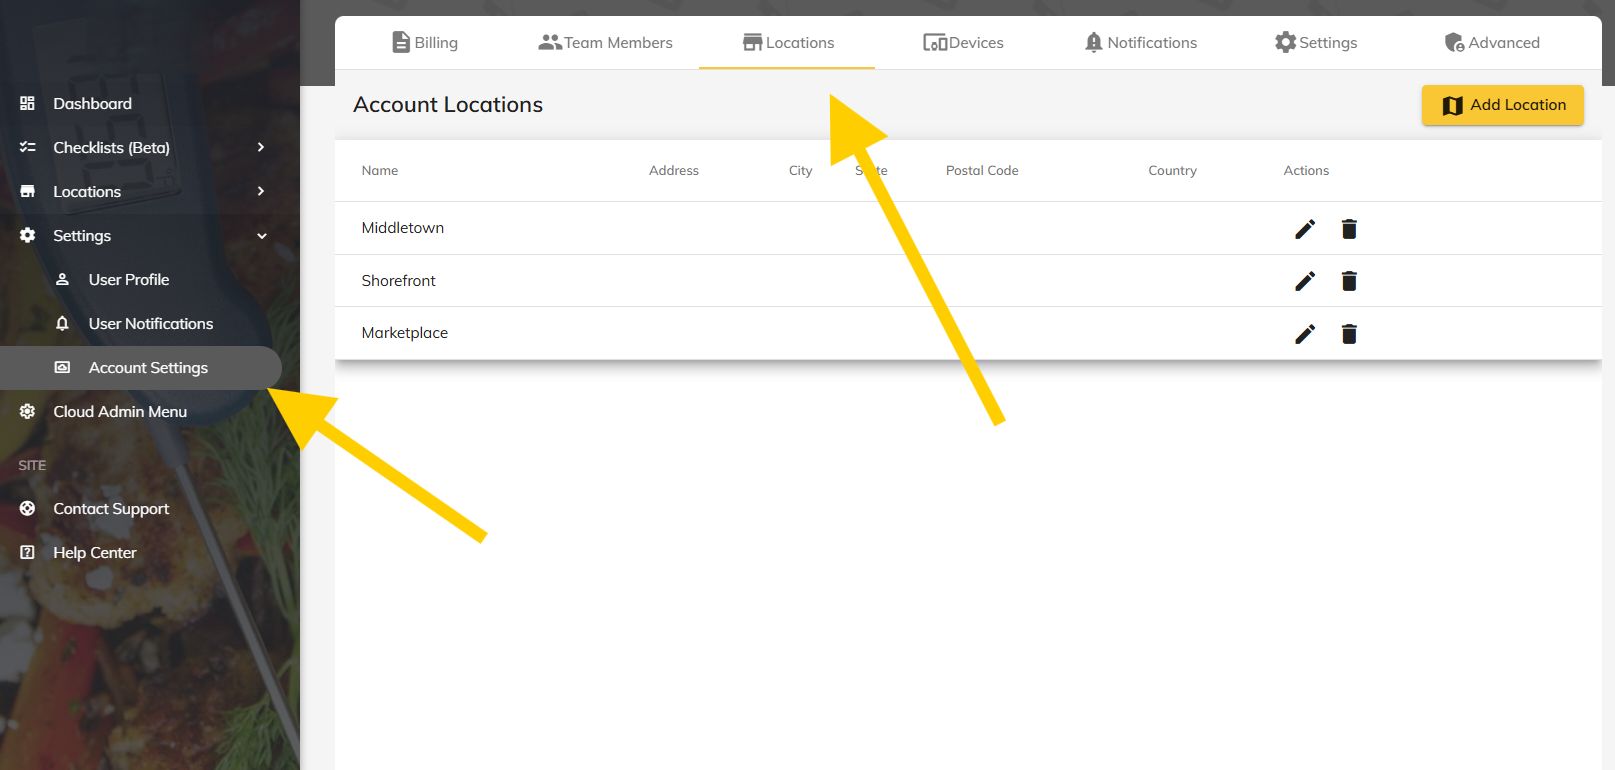
To access the Location Notification settings: Account Settings>Locations
Important: If a device is assigned to a location and you have disabled the location’s notifications, you will not receive notifications about that device.
Use the drop-down menu to choose if you’d like to receive Alert notifications (when there are Severity level 4 events) and/or if you’d like to receive Recovery notifications (when an event returns to a Severity level 3 status).
If you’d like to receive location alerts according to a certain time schedule, choose the Start Hour, the End Hour, and the days of the week you’d like to receive notifications. (See above for more information about setting location schedules correctly.)
_____
I
User Notifications
User notifications are dependent upon location and account settings.
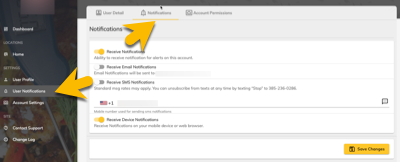
Use the User Notifications tab to choose to which type of notifications the user will receive.
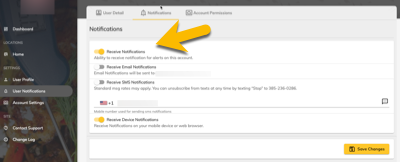
In order for the user to receive notifications, you must have the Receive Notifications option selected.
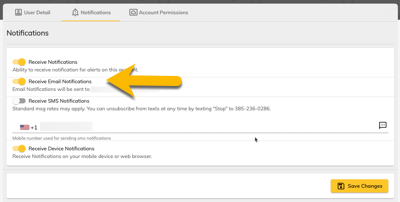
To receive email notifications, toggle Receive Email Notifications option on and save the changes. (Note: The email notifications will be sent to the user’s account email address.)
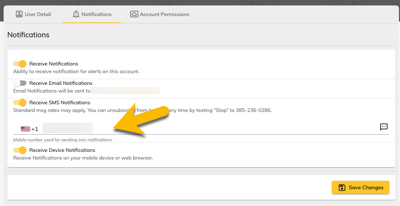
To receive SMS (text) notifications, toggle Receive SMS Notifications on, enter the phone number, and save the changes.
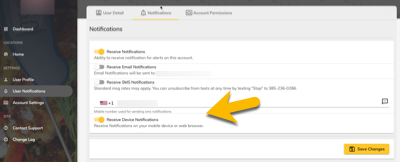
In order for the user to receive notifications on your mobile device or web browser, you must have the Receive Device Notifications option selected.
J
Data Logger Specific Information
Connecting Your ThermaData WiFi Logger to Your Wi-Fi Network
Before you can add your ThermaData WiFi logger to your ThermoWorks Cloud Account, it must be connected to your Wi-Fi network.
You may use your smart device or Wi-Fi enabled computer to send the Wi-Fi credentials to your ThermaData logger
- On your ThermaData logger, press and hold the Start and MAX/MIN buttons simultaneously for 5 seconds. The display will show ‘Set uP.’
- Open your Wi-Fi settings on your smart device or Wi-Fi enabled computer.
- Select ‘ThermaData Dxxxxxxxx’ from the list of available networks. It will show your ThermaData loggers serial number in the name.
- If setting up on a smart device, you may see a message asking if you want to stay connected. Select ‘Yes’.
- Open a browser and enter either http://my.thermadatawifi or http://192.168.1.1 in the address bar
- You should see the ThermaData WiFi Configuration page.
- Select your Wi-Fi network name from the drop down list.
- Select your Security Type from the drop down list.
- Enter in your Wi-Fi password into the Security Key field.
- Click ‘Save Configuration.’
- Your ThermaData logger should now be connected to your Wi-Fi network and show both a cloud symbol and a Wi-Fi Signal symbol on the display.
Managing Data Loggers in ThermoWorks Cloud
How to Add a Data Logger to Your Account
There are two ways to add a data logger to your account:
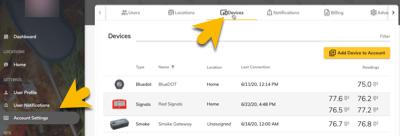
1. Navigate to the Devices tab in Account Settings. Click on the Add Device to Account button. If you use this option, the data logger is not yet assigned to a specific location.
2. From a location’s dashboard, choose Add Device to Location. This option will add the data logger directly to a location.
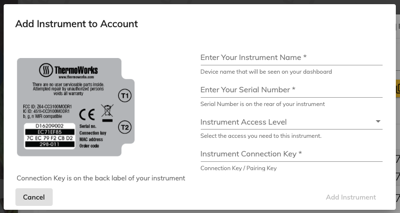
When assigning Instrument Access Level rights, choose if you want to assign Read Only rights (the ability to receive notifications and see data) or Full Access rights (the ability to receive notifications, see data, and change settings) to a location’s data logger devices.
Add the pertinent information for the data logger you are adding to the account and click Add Instrument to finish.
Device Dashboard
How to Access Device Dashboard
There are three ways to access a device’s dashboard:
- ThermoWorks Cloud Dashboard > Select device
- Locations > Location Name > Select device
- If a device has been previously set up in your account, may search for device’s name, serial number, account name, or location (top-right corner of window) > Select device
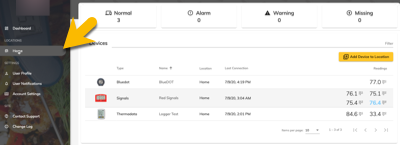
Top Messages
Normal: This is the total number of devices you currently have attached to your account that are not in another state.
Alarm: The number of data loggers that have exceeded their high or low temperature limits.
Warning: The number of data loggers that are close to exceeding their high or low temperature limits.
Missing: The number of data loggers that have missed a set number of transmissions, if Monitor is enabled. (Set up on the device’s home page > Monitors)
All About Graphs
Important to Know About Graphs
- The instrument sample rate determines how much data is displayed on a graph.
- You may save an unlimited number of graphs.
- If you wish to begin a graph that begins at a particular time, you must start a new session. If you wish the end a sessions’ graph to end at a particular time, you must end the session.
Graph Display
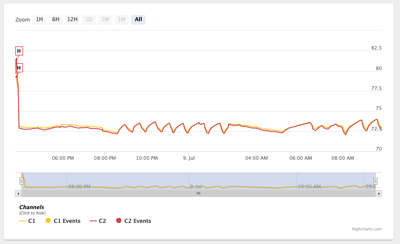
A device’s dashboard includes the current graph. The amount of data displayed on the graph is dependent upon the instrument sample rate. (To set a data logger’s sample rate: Device>Settings>Instrument Sample Rate)
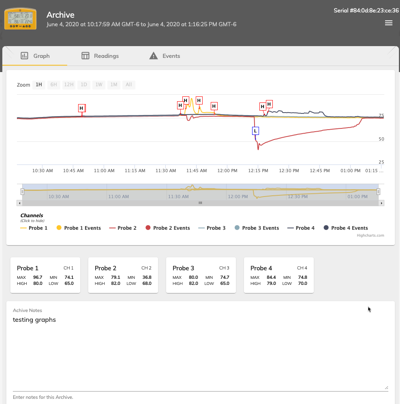
Working with Graphs
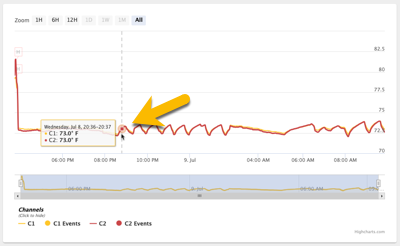
Hover your mouse over the graph to see the exact date, time and temperature. Click on a channel’s name in the bottom list to hide its channel on the graph. Click again to show it.
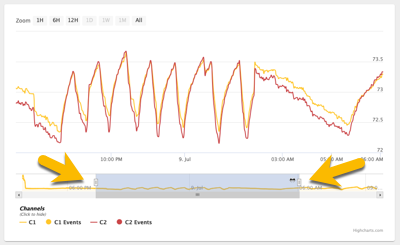
Use the sliders at the bottom to zoom in on a portion of the graph.
Select a period of time you wish to view at the top-left of the graph. Use the bottom slider to move the time selection along the graph. Any time period that is not available to select is greyed out. The time period options are dependent upon the length of the current graph.
Notes
To add or edit notes about the current graph or session, navigate to the device’s home page and scroll down to see the Notes section. To include the notes you have added to the graph’s archive, choose End Session or Archive Graph. The graph will reset and any notes entered will be saved.
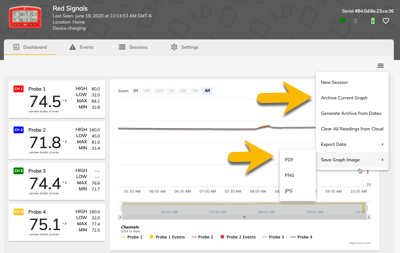
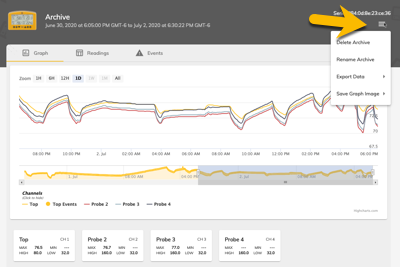
Save Dashboard Graph as Image
Use the top right-hand menu on the dashboard to archive the current session’s graph or save it as .pdf, .png, or .jpg image.
Back to Top
About Sessions
Important to Know about Sessions
- Sessions allow you to choose when a data set will begin and end.
- You may save an unlimited number of sessions.
- When you start a new session, the current graph will be cleared.
Use the top-right hand menu to access your available sessions options.
- Start a New Session: This option clears the current graph and starts.
- Edit Session: Edit the session’s name here.
- End and Save Session: This will archive the current session. You can then locate it at Archive>Saved Sessions
- End without Saving the Session: This will end the session and its data will not be available in the archive.
Back to Top
Events
The Events tab contacts a listing of all of the events that occurred during the current session.
Add Notes to Events
You may add notes to level Severity level 4 events by clicking on its record. A dialogue will open that allows you to add a description of what happened during the event and what was done to resolve it.
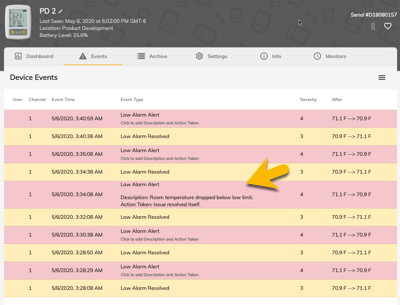
The new note will then appear under the event’s name.
Important: You may add additional notes to an event, but you may not edit a saved note.
Clear Events
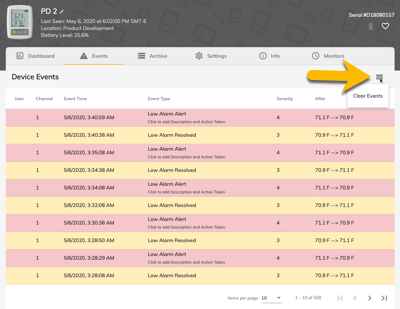
Use the Clear Events option to clear the current session’s event list. Note that this only clears the current events list. It does not removed events associated with previously archived sessions.
Back to Top
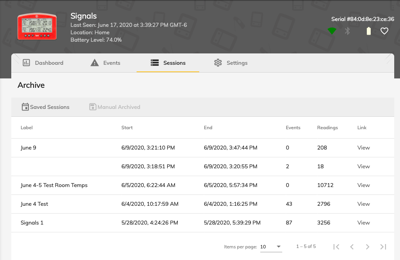
Archive
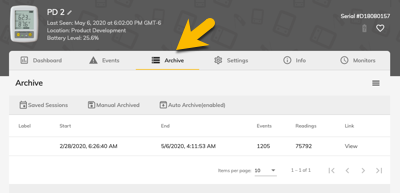
The Archive tab contains a list of all of your archived sessions. Through it, you will be able to access your saved sessions, manual archives, and automatically archived files.
An Archive contains:
- A graph
- Archive notes (You may edit the notes.)
- The readings taken during the session (Readings tab)
- Events list (Events tab)
You can delete or rename an archive, export its data to an Excel 2007+ or .csv file, or save its graph as a .png, .jpg, or .pdf image file via the top right-hand menu.
Saved Sessions
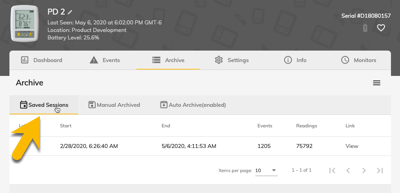
This option allows you to access the sessions you have saved. To save a session: Device Dashboard>top right-hand-menu>End and Save Session
Manual Archived
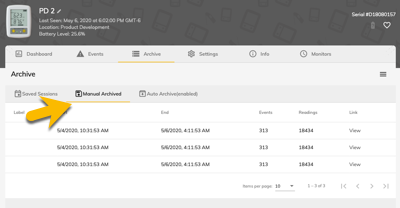
All of your manually archived files are listed here. These include:
- Archived graphs
- Archives generated from dates
- Cached instrument information request files
- Full instrument information request files
- All readings from instrument request files
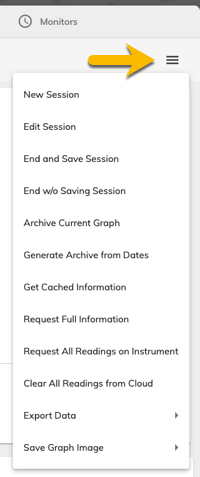
Note: You can find all available manual archive options in the device dashboard’s top-right hand menu.
Auto Archive
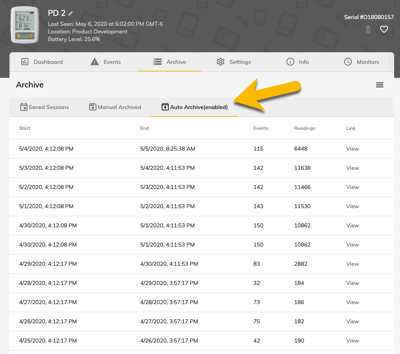
If enabled, Auto Archive automatically archives data every 24 hours. (This time period cannot be altered.)
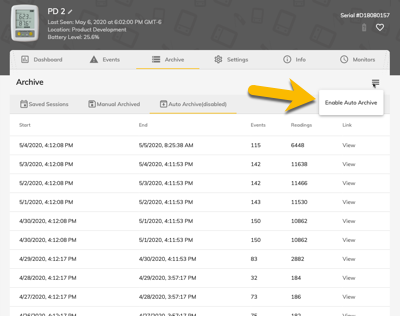
Use the top-right menu to either enable or disable the auto archive feature.
Back to Top
Settings
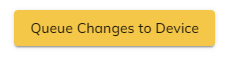
*IMPORTANT NOTE: Changes with instrument settings will not be sent to the device until you click the “Queue Changes to Device” button in the lower right hand corner of the screen:
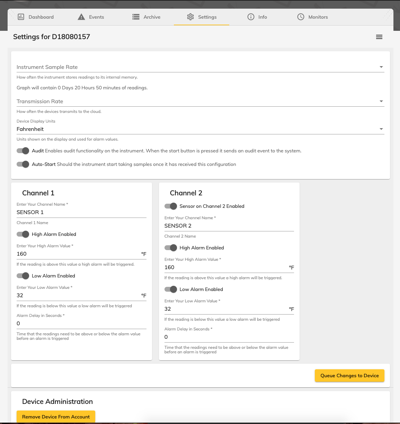
Instrument Sample Rate
Use this setting to determine how often the data logger will take a reading. It will also determine how much graphing data is located on the device’s dashboard.
Transmission Rate
Use this setting to determine how often the data logger will transmit readings to ThermoWorks Cloud.
Note: The frequency of transmissions affects how long a data logger’s battery lasts.
Device Display Units
Choose to have the device read in either Fahrenheit or Celsius.
Audit
When the data logger’s start button is pressed, all of the current readings on the device will be immediately downloaded and all pending setting changes will be made. The data file will be flagged to let you know that someone triggered the download by physically pressing the logger’s button.
Example: A grocery story or warehouse may choose to use the audit function to validate that employees make their assigned rounds to check loggers.
Auto-Start
Determine if you want the logger to start taking samples as soon as it receives new settings changes.
Channel Sensor Settings
Choose sensor high, low, and alarm delay setting here.
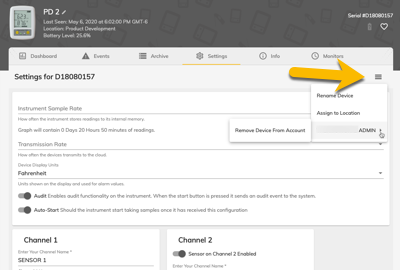
Use the top right-hand menu to either rename the device, assign it to a location, or completely remove it from the account. You may also remove the device from the account using the Remove Device from Account button, located at the bottom of the Settings page.
*IMPORTANT NOTE: Changes with instrument settings will not be sent to the device until you click the “Queue Changes to Device” button in the lower right hand corner of the screen:
Back to Top
Info
Use the Info tab to review specific details about your logger, the Wi-Fi connection and strength, and the instrument settings you have chosen.
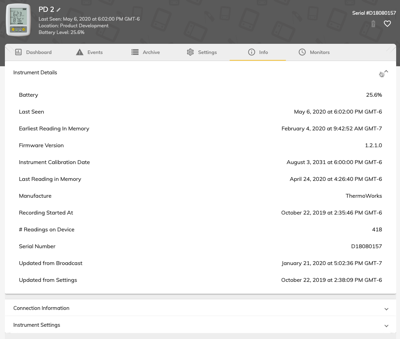


Back to Top
Monitors
Monitors allow you to create notifications when the data logger has missed a specified number of transmissions. These notifications will be sent to specified users. You will also receive a notification telling you how many loggers have missed readings in the top message area of your ThermoWorks Cloud Dashboard (Missing).
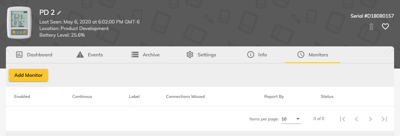
Click on the Add Monitor button to create a new monitor.
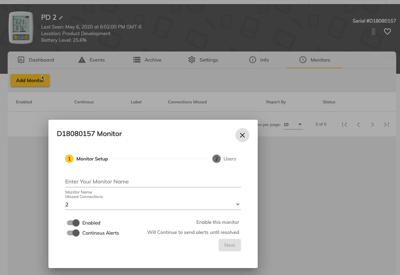
Use the first dialogue to name the monitor, choose how many transmissions can be missed before the alerts are sent, and to decide if you want to receive continuous alerts until the issue is resolved. Click Next to continue.
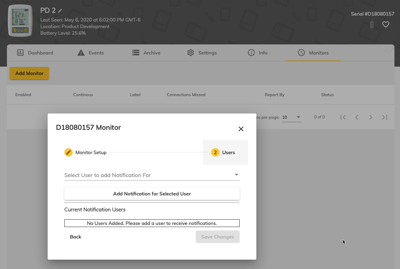
Choose which users will receive the alerts here.
Note: Add or edit users in Account Settings.